How Can My Business Understand and Handle Those Pesky Data Anomalies?
Why guess at the cause of your business results? Whether you are seeing positive or negative results, it is still important to understand the ‘why.’ Without this information, you cannot adapt and adjust to improve declining results, OR repeat and improve those great results you are experiencing.
When you analyze results for the purpose of understanding and clarifying what is happening to product sales, to regional results, to financial investments, or other business factors, you may see trends and patterns that help you decide on a strategy to face a challenge or to capitalize on an opportunity. But how to you handle those perplexing anomaly results?
An anomaly is a pattern or result that does not conform to expected normal behavior. Let’s say your business spends an average of $5,000 per month, but in December of last year, it spent $10,000. That would be an anomaly! If a particular medication resulted in improvement in 80% of the 20,000 patients to whom the drug was administered, but 1% of the patients experienced a decline in health, that would be an anomaly.
With anomaly monitoring and alerts, users will have clear insight into the root cause of a problem or anomaly, and understand the key influencing factors. Your business can monitor and manage volatility and understand the relationships and impact of the various influencers on the targets, products, sales, customers, etc.
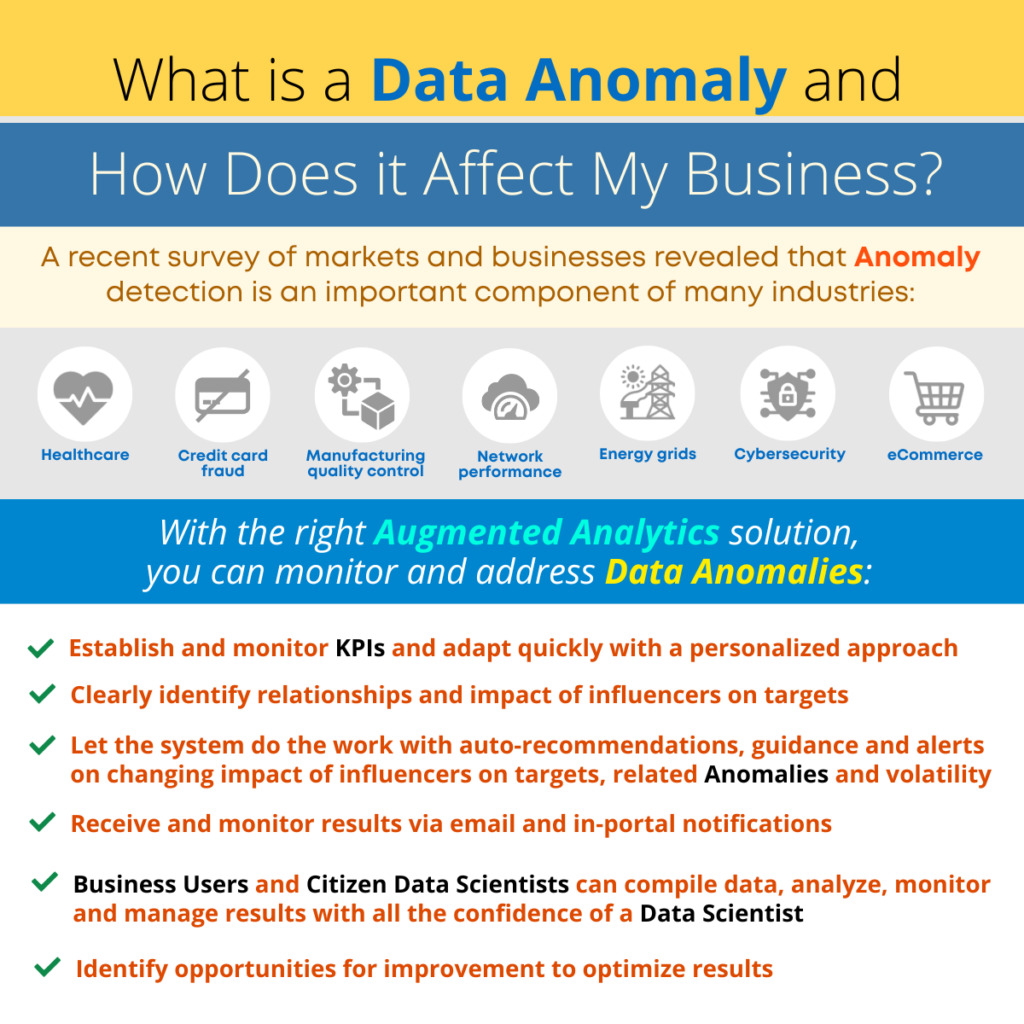
A recent survey of markets and businesses revealed that anomaly detection is an important component of many industries:
- Healthcare
- Credit card fraud
- Manufacturing quality control
- Network performance
- Energy grids
- Cybersecurity
- eCommerce
These are just a few of the industries, markets and functions that can benefit from anomaly monitoring.
When it comes to analytics, anomaly monitoring and analysis can help your business to identify outliers in results and determine whether these are important warnings of future issues, or simply occasional blips in results.
When your augmented analytics solution is designed to be a self-serve, business user application, you can support the transition of team members to Citizen Data Scientists with interactive tools to gather information, establish metrics and key performance indicators (KPIs) and identify volatility of results and anomalies in the results. Your team will receive auto-suggestions that will define the root cause of the problem and target opportunities.
Users will have clear insight into the root cause of a problem or anomaly, and understand the key influencing factors. Your business can monitor and manage volatility and understand the relationships and impact of the various influencers on the targets, products, sales, customers, etc.
Here are some of the business benefits of selecting an augmented analytics solution with anomaly monitoring and alerts:
- Establish and monitor KPIs and adapt quickly with a personalized approach
- Clearly identify relationships and impact of influencers on targets
- Let the system do the work with auto-recommendations, guidance and alerts on changing impact of influencers on targets, related anomalies and volatility
- Receive and monitor results via email and in-portal notifications
- Business Users and Citizen Data Scientists can compile data, analyze, monitor and manage results with all the confidence of a Data Scientist
- Identify opportunities for improvement to optimize results
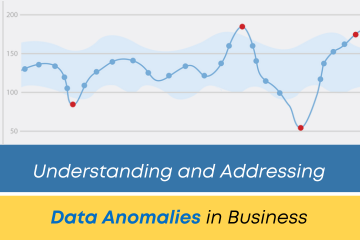
An anomaly is a pattern or result that does not conform to expected normal behavior. How to you handle those perplexing anomaly results?
Smarten SnapShot Anomaly Monitoring And Alerts will support your team with tools that are intuitive and easy to use and will encourage user adoption. Leverage the essential components of Augmented Analytics and improve decision-making and outcomes.
 Anomaly Alerts, Anomaly Analytics, Augmented Analytics, Augmented Analytics Benefits, Augmented Analytics Company Ahmedabad, Auto Insight, Citizen Data Scientist, Influencer Analytics, Predictive Analytics for Business Users, SnapShot, Volatility Detection
Other posts