
By a small sample, we may judge the whole pic!
All of us might have used the concept of sampling in our routine life. For instance, while purchasing vegetables from a shop market, don’t we examine a few to assess the quality of the whole lot? Doesn’t a doctor examine a few drops of blood as a sample in order to draw conclusions about the blood constitution of the entire body? Most of the time while dealing with big data problems, it’s not feasible to collect data from the whole population. Thus, sampling techniques are a useful procedure for selecting a subgroup (i.e., sample) from a population that is expected to be a representative of the whole population, in turn saving the time, cost as well as the efforts needed in examining the complete data. If anything goes wrong with the sample of data, then it will be directly reflected in the final result.
1. Sampling Techniques: Get accurate results from data by employing fewer resources!
Before we get too into the weeds of dealing with Sampling using Smarten, let’s inspect the two widespread sampling techniques i.e., Simple Random Sampling and Stratified Sampling.
1.1 Simple Random Sampling:
The selection mechanism for this sampling technique is purely based on chance wherein every item has an equal chance of being selected. A popular example demonstrating this strategy is a lottery system. This technique is favorable owing to the fact that it is less time consuming as well as economical in nature. However, simple random sampling has shortcomings in obtaining the representative sample for full data collection as well as possesses higher chances of bias.
1.2 Stratified Sampling:
The selection mechanism for this sampling technique is such that the entire population data is divided into subgroups where the members in each of the subgroups have similar attributes and characteristics. A random sample from each of these subgroups is taken in proportion to the subgroup size relative to the population size. These subsets of subgroups are then added to formulate a final stratified random sample. Improved statistical precision is achieved through this method due to the low variability within each subgroup, and the fact that a smaller sample size is required for this method as compared to simple random sampling. This method is used when the researcher wants to examine subgroups within a population. Besides being economical in nature along with being a less time-consuming technique, this methodology has less chance of bias as well as being capable of achieving higher accuracy compared to simple random sampling. However, in order to perform stratified sampling, one needs to define the categorical variable by which sub groups should be created. For instance, Age group, Gender, Occupation, Income, Education, Religion, Region etc.
2. Smarten SSDP (Self-Serve Data Preparation) truly makes Analytics Self-Serve!
Smarten SSDP is a crucial component of Advanced Data Discovery, enabling sophisticated features and functionality in an easy-to-use, intuitive, interactive environment that users will want to adopt and leverage. In addition to various easy to adapt features provided, Smarten SSDP assists in performing Sampling techniques with barely any effort being put in by the business user. Let’s gradually familiarize ourselves in approaching data sampling using Smarten SSDP.
2.1 Open the dataset on which sampling is to be performed and navigate to the sampling icon:
The highlighted icon depicts the Sampling feature in Smarten:
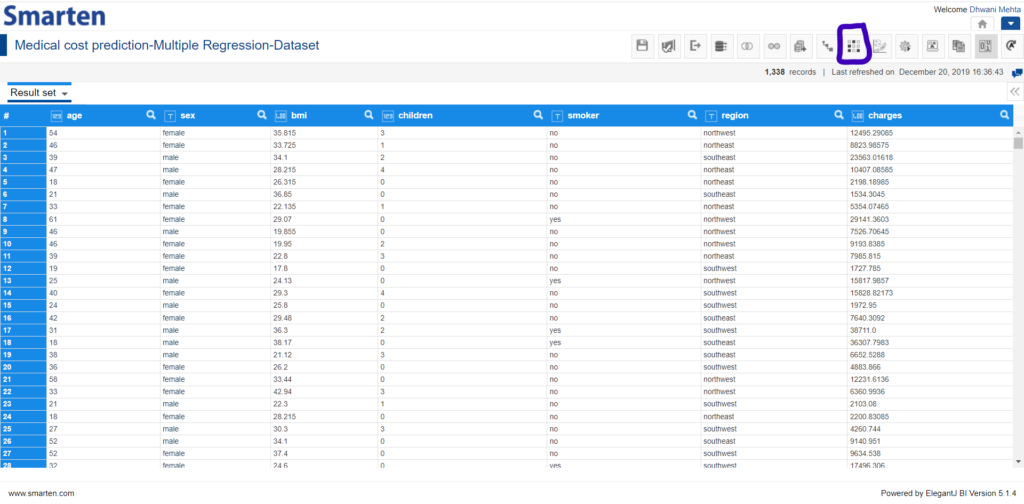
Sampling Icon in Smarten SSDP
2.2 Open the Sampling window to perform further operations:
The next straight-thinking step is to click the Sampling icon and to understand what it offers. The following panel opens up on clicking the Sampling icon:
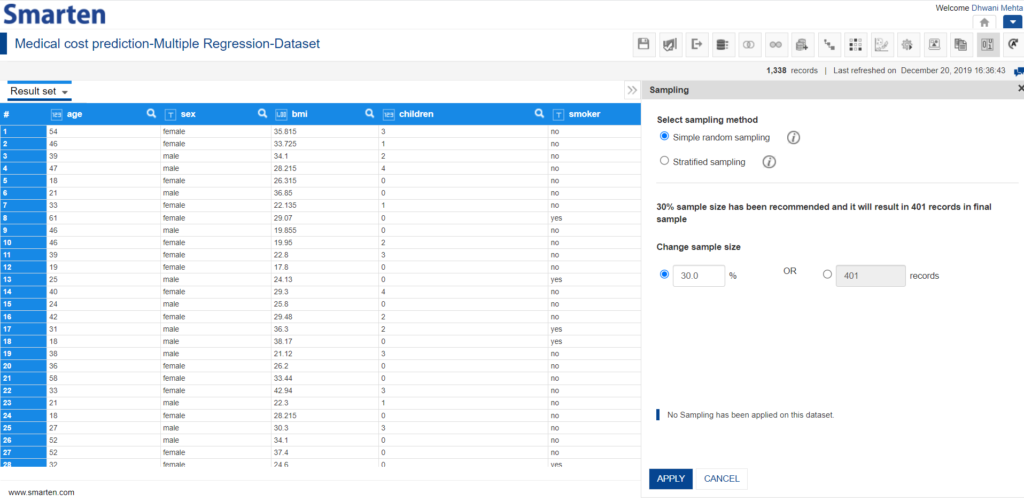
Sampling Window
It’s straightforward to understand from this window that smarten offers both the techniques discussed before (i.e., Simple random sampling and Stratified sampling) and the user can choose the best one applicable. Let’s quickly look at each technique utilizing Smarten SSDP.
2.3 Perform simple random sampling using Smarten SSDP:
Simple random sampling can be effortlessly performed on selecting the corresponding radio button. Smarten automatically performs the operations involved and outputs the sampled dataset for the chosen dataset by pressing the Apply button. By default, the sample size is kept to be 30% of the total number of records but the users have flexibility to edit the default set sample size by inputting the percentage of total records for the sample or by simply providing the number of records to be considered for the sample.
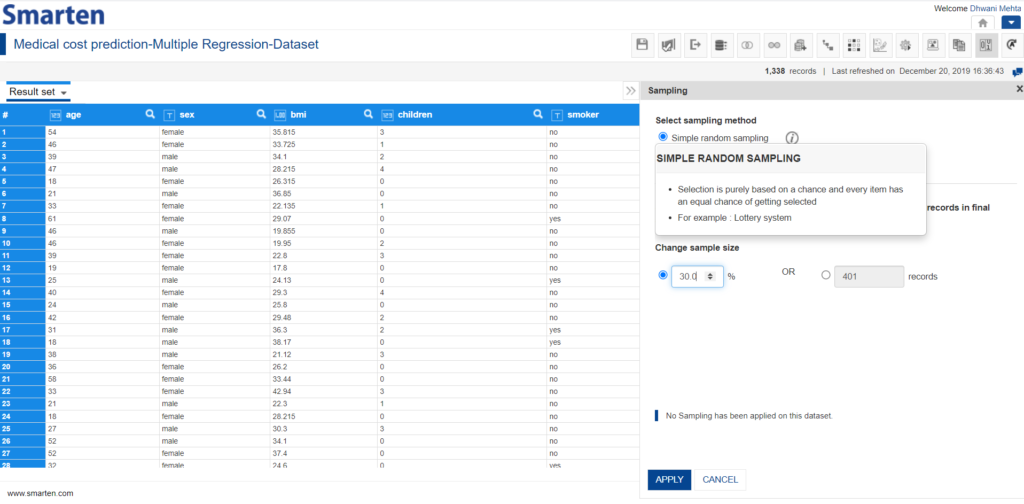
Perform Simple Random Sampling using Smarten SSDP
2.4 Perform stratified sampling using Smarten SSDP:
Stratified sampling can again be simply performed by selecting the corresponding radio button.
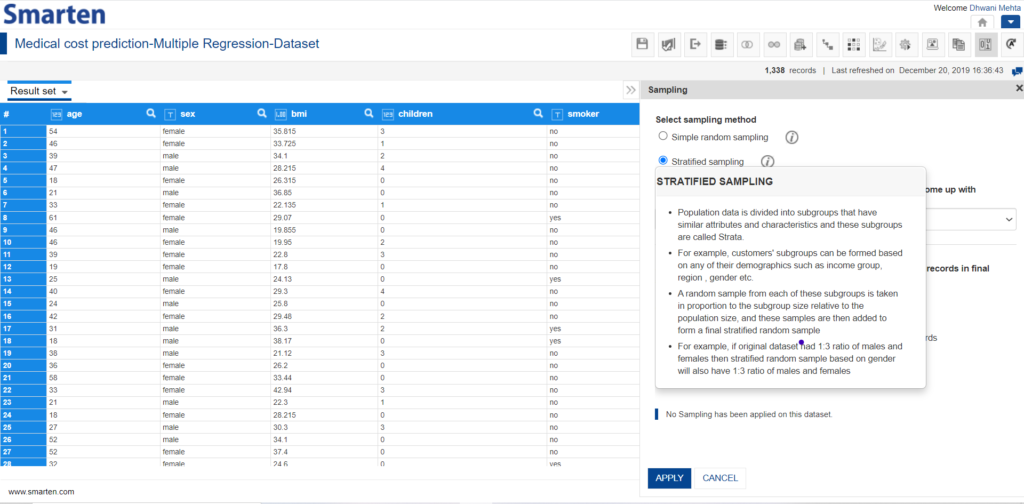
Perform Stratified Sampling using Smarten SSDP
As this category of sampling a consideration is made that a particular class comes up with proportionate class counts in the sample as well. In order to select the class whose proportion is to be maintained, one must select it from the drop-down list provided as follows:
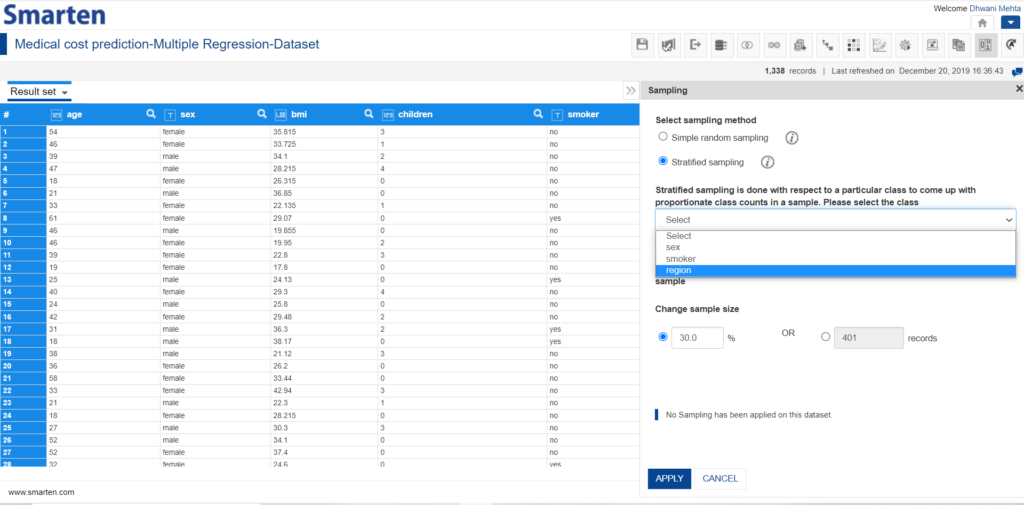
Selecting the class for generating proportionate counts in the sample
Smarten automatically performs the subsequent operations involved and outputs the sampled dataset for the chosen dataset by pressing the Apply button. By default, the sample size is kept to be 30% of the total number of records in this technique as well and the users have flexibility to edit the default set sample size by inputting the percentage of total records for the sample or by simply providing the number of records to be considered for the sample set.
3. SmartenInsight: Explore, Discover and Gain insight from data can’t be any easier!
Many a time the same dataset can formulate more than one use-case or the same use-case could be analyzed by different data science algorithms to draw varied insights. It might happen that we would prefer not to disturb our original data but opt for applying sampling techniques after choosing the algorithm technique. SmartenInsight provides this flexibility to its users and provides an option to choose to apply the algorithm technique on the full data or sample data. Generally, when the data is huge, it is advisable to go on with the sample data option in order to attain speed up.
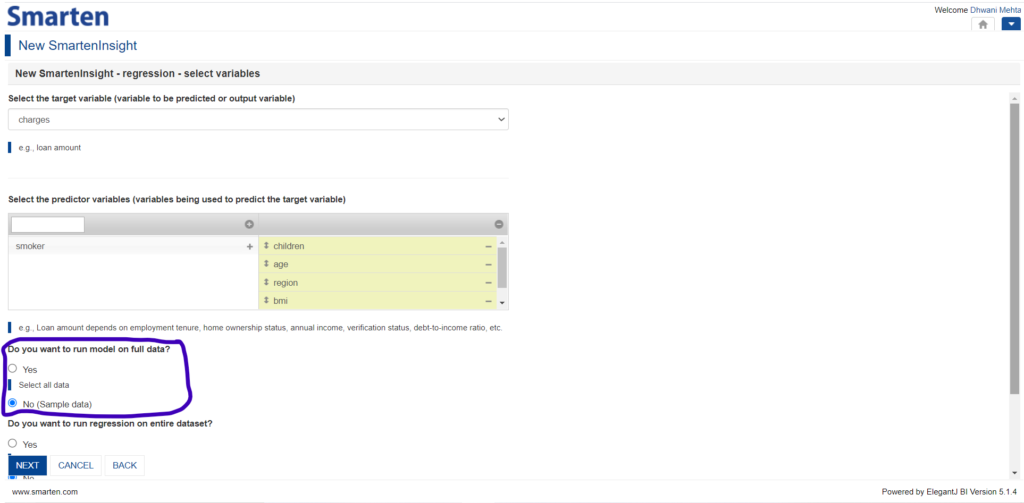
Option to run model of full or sample data in Smarten Insight
In order to reach this screen, create a new SmartenInsight.
Go to New -> SmartenInsight -> Choose the algorithm technique of interest -> Select the dataset of interest
4. Smarten Assisted Predictive Modelling: Take the Guesswork out of Planning!
Smarten Insight provides predictive modeling capability and auto-recommendations and auto-suggestions to simplify use and allow business users to leverage predictive algorithms without the expertise and skill of a data scientist. In addition to many fine features provided, Smarten Assisted Predictive modelling also provides utility to sample data even once the requisite machine learning model has been created. Once the algorithm has been applied, we can navigate to the sampling icon and the following screen pops up:
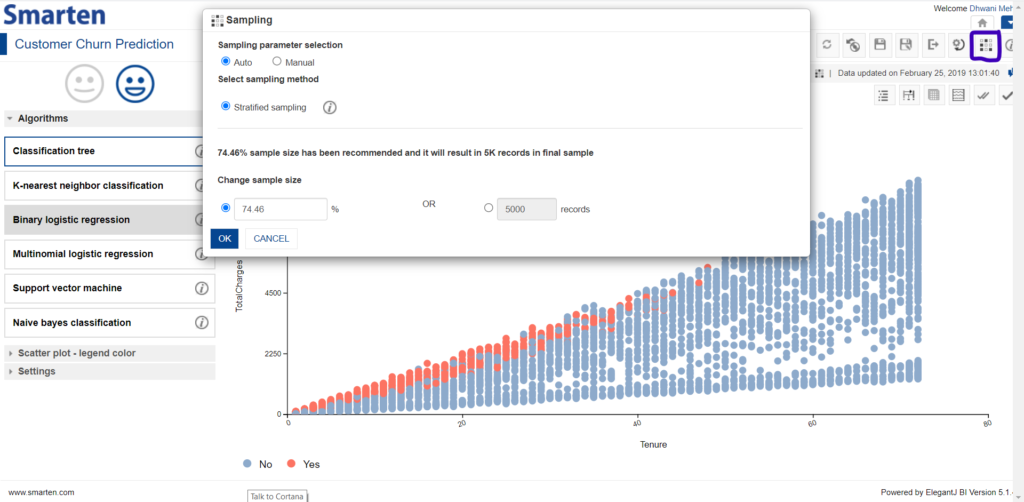
Sampling option in Smarten Assisted Predictive Modelling
As perceived from the screen, two sampling modes are provided, namely Auto and Manual mode. The Auto mode performs sampling such that the sample size is set to 5000 if the number of records in the studied dataset is more than 5000, else the sample size corresponds to the full data. By default, Auto mode is selected. However, the users are provided an option to select the sample size and sampling technique of their interest by switching to the Manual mode for sampling.
5. Nobody is Perfect! The data we are surrounded by might have Class Imbalance imperfection
Often while dealing with classification problems, the number of observations belonging to one class are significantly lower/higher than those belonging to other classes, in simpler terms, the data is skewed towards some particular class observations leading towards deteriorating predictive performance specifically for the minority class. Class imbalance poses a threat while performing classification as the model might treat the minority class as a noise and fail to predict that class besides proclaiming good accuracy. In such a scenario, handling the imbalanced data becomes crucial and one of the renowned approaches to deal with this is to resample the data.
5.1 Handling Class Imbalance by simply resampling data differently
One of the noteworthy and straightforward approaches to deal with this problem is to resample the dataset either by decreasing the abundance of the majority class or by increasing the frequency of the minority class leading towards reducing the ratio between the class frequencies for performing better classification. The techniques are well known as Under sampling and Oversampling respectively.
5.1.1 Under sampling – Deleting samples from the majority class
Consider fraud detection in banking. The banking events, like debit or credit card transactions or money transfers, are predominantly valid. Only a small percentage of events are fraudulent, which leads to an imbalanced dataset. Now if an organization is trying to get better at identifying fraudulent events, this imbalanced data could skew it toward wrongly labeling transactions. In order to gain real insight from such an imbalance data, we can put to use under sampling as a resampling technique which seeks to randomly remove samples from the majority class in order to maintain an equivalent ratio among all classes. This technique is well suited when there is plenty of data for accurate analysis as here, we are removing information from the majority class in order to make a balanced dataset. However, it is always important to consider the prospects of valuable information being deleted as we randomly remove them from our data set.
5.1.2 Oversampling – Duplicating samples from the minority class
Let’s contemplate another real-life use case exhibiting the class imbalance problem. Consider the customer churn use case wherein the vast majority of customers stay with the service (the “No-Churn” class) and a small minority cancel their subscription (the “Churn” class). To get appropriate predictions, we can apply oversampling to increase the number of instances in the minority class by randomly replicating them in order to present a higher representation of the minority class in the sample. This technique overcomes the drawback of under sampling by not leading to any information loss from the data. However, it poses a drawback of retarding the training process as well as can give rise to overfitting in the classification model.
6. It’s a Wrap!
Now that we have covered the prominent techniques to sample the dataset of interest as well as utilizing them in a straightforward manner using Smarten augmented analytics, we are all set to tackle any huge data by employing apt sampling techniques and win accurate outcomes. It can be comprehended that better data does not always mean more data. Though having more data, both in terms of a greater number of records and more features to study is a blessing, directing essential efforts in utilizing crucial components from the data in order to obtain correct insights is vitally important.
Note: This article is based on Smarten Version 5.0 as the base. This may or may not be relevant to the Smarten version you may be using.
Original Post : Sampling Data using Smarten Augmented Analytics!


