Reporting and Data Visualization Improves Team Understanding!
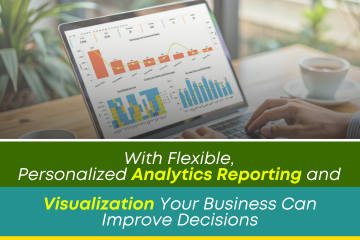
Statistics reveal that many people learn best when they see a story or information depicted in an image. Graphs, charts with colors, lines and shapes can often tell a story and communicate issues, challenges and opportunities in a business environment.
According to Forbes, ‘Almost eighty-thousand scientific studies attest that visual images promote retention.’
‘Visualization and presentation formats can include personalized dashboards and visualization techniques, alerts for exceptions and trends, and intuitive, mobile BI dashboards.’
Let’s consider a few examples of data presentation to illustrate how images, graphs, charts and visualization techniques can improve data understanding and retention.
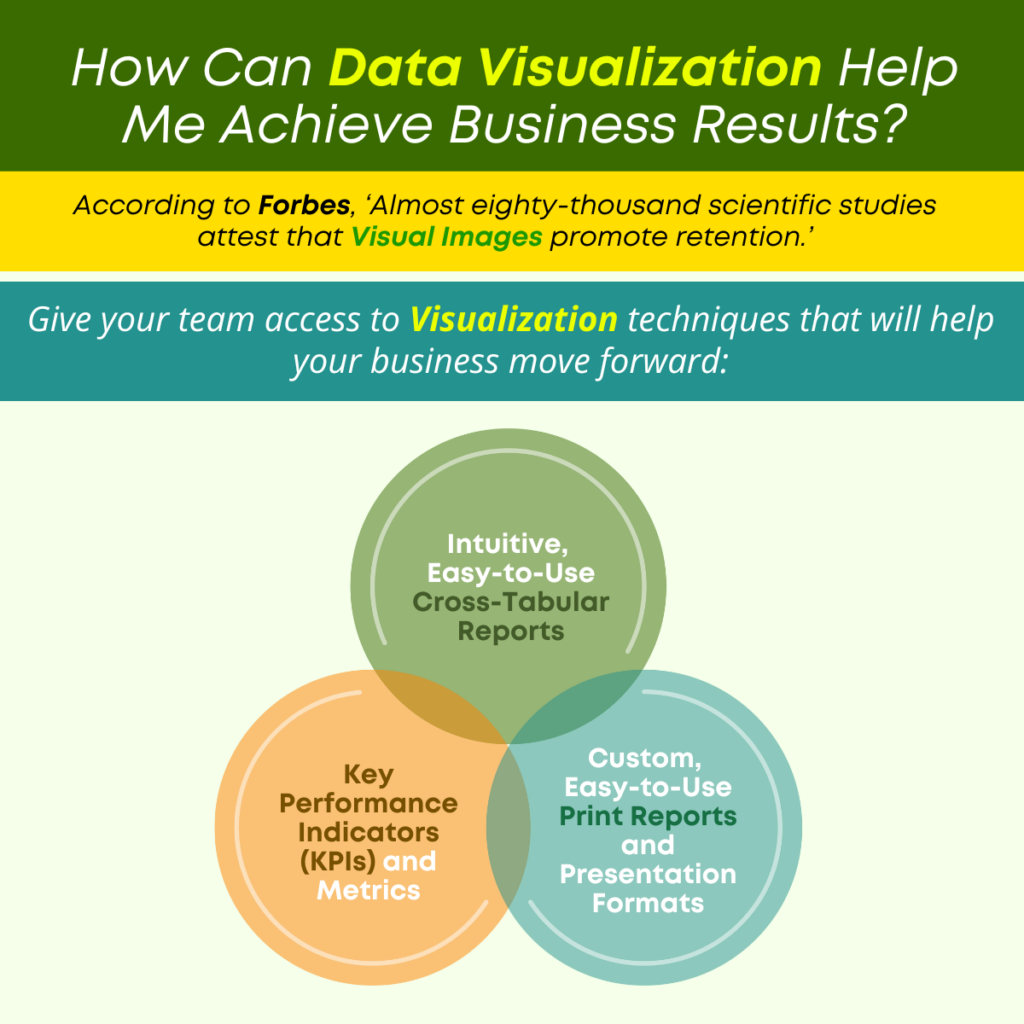
Cross Tabulation – Data presentation consists of categorization of data into groups, such as products, geographies, demographics, etc. It can be very useful in understanding sales results, product pricing response, target audience assessment, etc. Cross tab analytics can help your team understand market research, survey responses, seasonality and other factors.
KPI Reports – Key Performance Indicators (AKA KPI) can provide metrics in a dashboard environment that is easy to understand, so users can monitor and manage success factors, and quickly see where there are problems. KPI reporting can be used to identify and capitalize on opportunities and to adjust to challenges in the market and within the walls of the organization.
Custom Print Presentations and Reports – Every organization has a need for custom reports. Needs vary from division to department to user, and these needs can be expensive to accommodate. Custom reports to present data for decision-making, or to monitor results on an ongoing basis are crucial to the organization. But if the enterprise has to ask IT or business analysts or data scientists to satisfy the need, they are losing productivity, time and efficiency. By giving users the ability to design, format and product reports for a particular staff meeting or project, the enterprise can keep the process moving and ensure that the team has what they need to gather, analyze and understand results in a meaningful way. Custom formats might include customer statements, management reports, compliance reports, project templates, etc. Users can present data in a clean, colorful, attractive way to satisfy customers, partners, suppliers, executives and team members.
‘According to Forbes, ‘Almost eighty-thousand scientific studies attest that visual images promote retention.’
These are just a few examples of reporting formats and types, and how they might help your enterprise. Other types of visualization and presentation formats can include personalized dashboards and visualization techniques, alerts for exceptions and trends, and intuitive, mobile BI dashboards.
Team members, managers and executives typically think of reporting and presentation as boring, detailed and unintelligible. They rarely see the value in using data to make decisions when, in fact, this approach is the wisest and produces the best results. But it is understandable that the staff, customers, partners and suppliers would cringe when a report is placed in front of them, emailed to them or presented on a screen.
What if you could create, format, present and share data in a way that quickly communicated results, delivered a message, identified an issue or illustrate dan opportunity? Change the way your enterprise uses and interacts with data, with clean, clear, concise, elegant and colorful presentation.
Explore the benefits of Smarten Reports, and Pixel Perfect Print Reports and the use of this this seamless PDF Pixel Perfect Reports Solution, and the Smarten suite of Augmented Analytics can support your business users with self-serve tools that are intuitive and will encourage user adoption and fact-based decision-making.
 Analytics and BI Platforms, BI Tools India, Business Intelligence Reports, Dashboards, Data Visualization Software, KPI Software, Report Software, Smart Data Visualization Ahmedabad
Other posts