This article discusses the analytical method of Hierarchical Clustering and how it can be used within an organization for analytical purposes.
What is Hierarchical Clustering?
Hierarchical Clustering is a process by which objects are classified into a number of groups so that they are as much dissimilar as possible from one group to another group and as much similar as possible within each group.
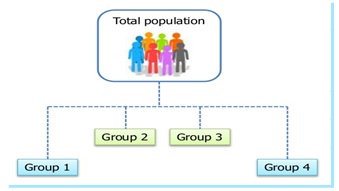
For example, items shown in the image above should be as similar as possible in terms of attributes of the items in each group, and objects in group 1 and group 2 should be as dissimilar as possible. All observations start in one cluster, and are then divided into two clusters. The data points within one cluster are as similar as possible, and the data points in other clusters are dissimilar from the other clusters being analyzed. For each cluster, we repeat the process until the specified number of clusters is reached.

This type of analysis can be applied to segment customers by purchase history, segment users by the types of activities they perform on websites or applications, to develop consumer profiles based on activities or interests, and to recognize market segments, etc.
How Does and Organization Use Hierarchical Clustering to Analyze Data?
In order to understand the application of Hierarchical Clustering for organizational analysis, let us consider two use cases.
Use Case – 1
Business Problem: A bank wants to group loan applicants into high/medium/low risk based on attributes such as loan amount, monthly installments, employment tenure, the number of times the applicant has been delinquent in other payments, annual income, debt to income ratio etc.
Business Benefit: Once the segments are identified, the bank will have a loan applicants’ dataset with each applicant labeled as high/medium/low risk. Based on these labels, the bank can easily make a decision on whether to give loan to an applicant and how much credit to extend, as well as the interest rate the applicant will be given, based on the amount of risk involved.
Use Case – 2
Business Problem: The enterprise wishes to organize customers into groups/segments based on similar traits, product preferences and expectations. Segments are constructed based on customer demographic characteristics, psychographics, past behavior and product use behavior.
Business Benefit: Once the segments are identified, marketing messages and products can be customized for each segment. The better the segment(s) chosen for targeting by a particular organization, the more successful the business will be in the market.
Hierarchical Clustering can help an enterprise organize data into groups to identify similarities and, equally important, dissimilar groups and characteristics, so that the business can target pricing, products, services, marketing messages and more.
The Smarten approach to augmented analytics and modern business intelligence focuses on the business user and provides tools for Advanced Data Discovery so users can perform early prototyping and test hypotheses without the skills of a data scientist. Smarten Augmented Analytics tools include assisted predictive modeling, smart data visualization, self-serve data preparation, Clickless Analytics with natural language processing (NLP) for search analytics, Auto Insights, Key Influencer Analytics, and SnapShot monitoring and alerts. These tools are designed for business users with average skills and require no specialized knowledge of statistical analysis or support from IT or data scientists. Businesses can advance Citizen Data Scientist initiatives with in-person and online workshops and self-paced eLearning courses designed to introduce users and businesses to the concept, illustrate the benefits and provide introductory training on analytical concepts and the Citizen Data Scientist role.
The Smarten approach to data discovery is designed as an augmented analytics solution to serve business users. Smarten is a representative vendor in multiple Gartner reports including the Gartner Modern BI and Analytics Platform report and the Gartner Magic Quadrant for Business Intelligence and Analytics Platforms Report.


