Give Your Team Traditional and Modern BI in One Solution!
Business Intelligence (BI) solutions have been around for some time. The traditional BI tools were designed to be used by the IT team, business analysts and data scientists and utilized sophisticated features which required specialized knowledge and skills possessed only by the technical and analytical community. In this environment, business users were consumers of content, and while they could access information from dashboards, reports and KPIs, they had very limited access to date and they could not interact with that data. Where users had access to data, BI objects, reports and dashboards were developed, provisioned and presented to them by the IT team, so the business user had no control over what they could see or the format of the data.
‘In the past, business users were restricted to analytical content provided by IT staff and Data Scientists with limited interaction and access to data’
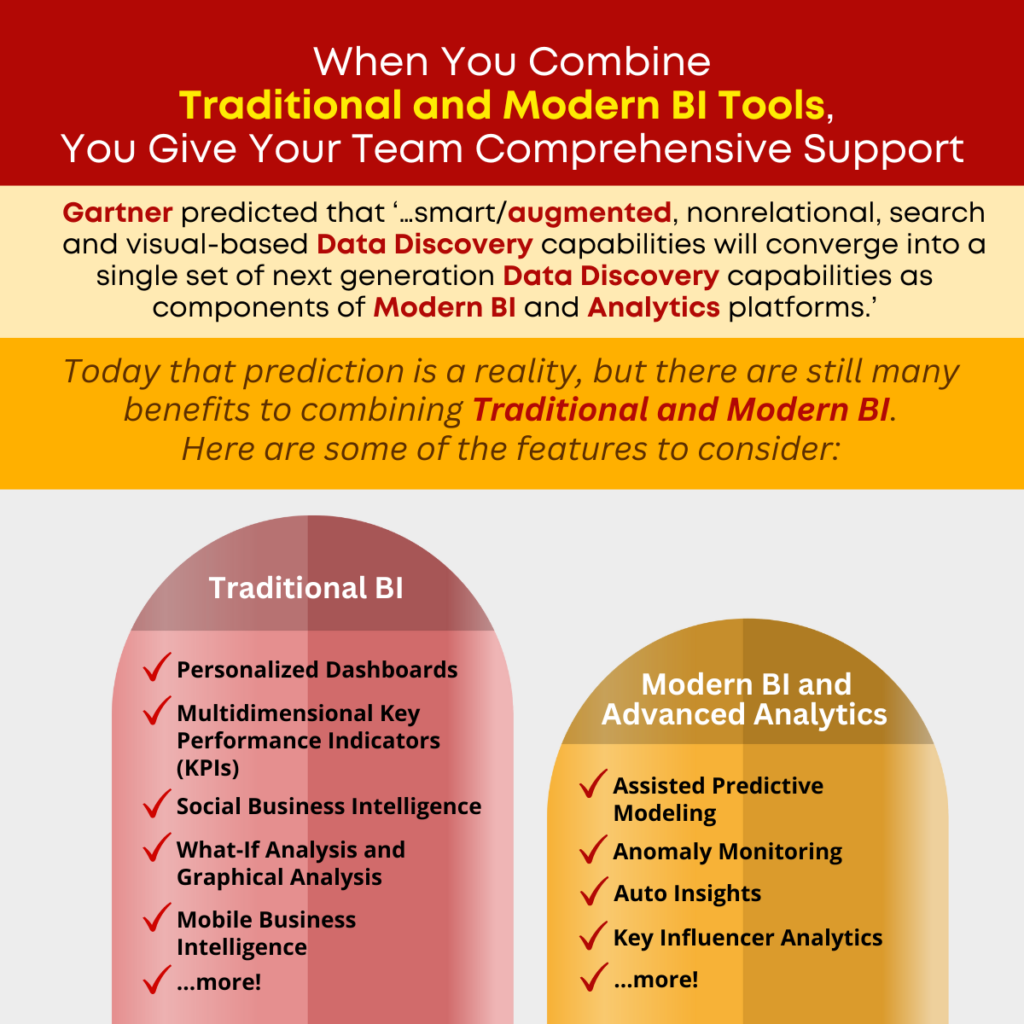
Gartner predicted that ‘…smart/augmented, nonrelational-, search- and visual-based data discovery capabilities will converge into a single set of next generation data discovery capabilities as components of modern BI and analytics platforms.’
In line with Gartner predictions, the new world of Augmented Analytics and Modern BI solutions enables end-users and team members to access and use business intelligence (BI) to combine their industry and functional knowledge with clear, concise data. These new solutions are focused on business users, and on their empowerment, placing the power of true insight into the hands of business users and transitioning business users into Citizen Data Scientists. These solutions provide more value to the organization, improving technology Return on Investment (ROI), Total Cost of Ownership (TCO) and increasing efficiency with fact-based decisions. Modern BI and Augmented Analytics offers data integration and sophisticated analytical models and techniques in an easy-to-use interface that provides auto-suggestions and recommendations to speed the analytical process and ensure that users get what they need. It also provides report formats, publishing tools, alerts and analysis that can be shared by team members to encourage user adoption and collaboration.
As the needs of the average user evolve, most businesses find that a combination of traditional BI tools and Modern BI tools will best meet the needs of the team and ensure that every team member has the tools they need to get the job done.
Here are the primary features and functionality your business will need to capture Traditional Business Intelligence components and provide comprehensive coverage for your team. These solutions allow the IT staff to provide dashboards and reports for business user consumption and review:
- Personalized Dashboards – Users with average technical skills can design personalized dashboards in minutes without programming knowledge.
- Multidimensional Key Performance Indicators (KPIs) – The team can define KPIs using an intuitive expression engine and KPI software to set polarity, frequency and threshold levels.
- Social Business Intelligence – Imagine an environment where business users can access a business intelligence and analysis portal and see popular data to rate, share and comment.
- What-If Analysis – Enables business users to determine how a prospective change to a product, service, resource allocation, budget, schedule, pricing, raw material cost, labor cost, or other factors might affect the business bottom line.
- Graphical Analysis – Business users can leverage stunning visualizations, alerts for exceptions and trends, and intuitive, mobile BI dashboards with true deep dive capabilities!
- Mobile Business Intelligence – Business intelligence solutions your business users can enjoy with high-performance BI tools that will work on any size or type of device.
- GeoMap Support – Users can leverage geo maps, analyze data for any location, and define geographic areas with support for drill down, spot lighter and other features.
- Exceptions and Personalized Alerts – With exception reporting users can define thresholds, monitor Key Performance Indicators (KPI) and metrics, and even receive alerts when exceptions occur with the ability to set, modify and delete alerts based on specific thresholds.
- R Integration – Integrates seamlessly with R (the popular open source programming language and software environment for statistical computing), so users can integrate any R script with simple input and output configuration.
- Print Reports – The IT team can leverage a simple, basic programming or scripting environment to define format templates and produce reports for delivery by email.
- Web-Based BI Reports – Business intelligence reporting software enables users to point-and-click and drag-and-drop to create a report summarizing performance metrics, or operational data, without programming or database or SQL skills.
Modern BI and Advanced Analytics – Augmented Analytics enables the transition from business user to Citizen Data Scientist and supports data democratization and data literacy, allowing Data Scientists to focus on strategy and business user access to analytics to perform day-to-day analytics.
- Assisted Predictive Modeling – Predictive analytics for business users provides predictive modeling capability assisted by auto-recommendations and auto-suggestions to simplify use and optimize outcomes, allowing business users to predict outcomes without the expertise of a data scientist.
- Auto Insights – The Auto Insights Smarten toolset allows business users to simply select the dataset to be analyzed and let the system interpret the dataset, select important columns of data, analyze its type and variety and other parameters and use intelligent machine learning to automatically apply the best algorithm and analytical technique and provide data insights.
- Key Influencer Analytics – Focus on what matters and find the most relevant influencers for your target KPIs. Business users often find it difficult to identify the right targets and to understand relationships and factors that influence results.
- Anomaly Analysis – Reveal trends, anomalies and answers, map targets, focus on influencers that matter and adapt to succeed.
- Smart Data Visualization – Smart data visualization allows business users to view and analyze data to identify a problem and clarify a root cause and to make confident decisions.
- Self-Serve Data Preparation – Smart data discovery tools and augmented data preparation features allow business users with average skills to perform data preparation and transform, shape, reduce, combine, explore, clean, sample and aggregate data, without the need for SQL skills, ETL or other programming language.
‘As the needs of the average user evolve, most businesses find that a combination of traditional BI tools and Modern BI tools will best meet the needs of the team and ensure that every team member has the tools they need to get the job done.’
There are other many other features and components available to support users, IT, business analysts and data scientists in the traditional and modern analytics environment.
To find out more about Business Intelligence (BI) Solutions And Reporting, Contact Us. Discover the power of Augmented Analytics and see how your team can benefit from fact-based decisions, and cost-effective analytics and achieve a market advantage.
 Analytics and BI Platforms, BI Tools, BI Tools India, Business Intelligence Reports, Business Intelligence Solutions, Dashboard Tools, KPI Software, Modern BI and Analytics
Other posts