This article describes chi square test of association and hypothesis testing.
What is the Chi Square Test of Association Method of Hypothesis Testing?
It is used to determine whether there is a statistically significant association between the two categorical variables. This technique is used to determine if the relationship exists between any two business parameters that are of categorical data type. One might use this technique to determine whether gender is related to a voting preference or whether the two data points are independent and unrelated. An enterprise might also use Chi Square to determine if there is a relationship between the region in which a product is purchased, and the product or category of product that is purchased.
Let’s conduct the Chi square test of independence using two variables: Gender and Product category.
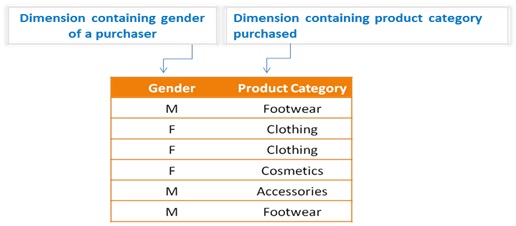
At 95% confidence level (5% chance of error) – As p-value = 0.041 which is less than 0.05, there is a statistically significant association between gender and product category purchased. So, Gender has an influence on the type of product being purchased.
At 98 % confidence level (2% chance of error) – As p-value = 0.041 which is greater than 0.02, there is no statistically significant association between gender and product category purchased, so Gender has no influence on the type of product being purchased.

This analytical technique can be used for numerous purposes.
Marketing / Market Research – To determine if certain types of products sell better in certain geographic locations than others, and to verify if gender has an influence on purchasing decisions. It might be used to identify if there is an association between income level of consumers and their choice of brand. To determine If customer age has an influence on product/service subscription (assuming age is converted into age buckets such as 18 to 25, 26 – 35 etc). This technique is helpful in finding a relationship between any demographic characteristic of consumers or research respondents for education, location, gender etc. and various preferences/perspective/behavioral attributes such as entrepreneurial characteristics, product/service preferences, career preference, income level, political party preference etc.
Finance – An organization might use this technique to Identify if demographic factors influence banking channel/product/service preference or selection of a type of term plan of an insurance etc.
How Can the Chi Square Test of Association Be Used for Business Analysis?
Let’s look at a few use cases that depict the value of the Chi Square Test of Association.
Use Case – 1
Business Problem: A retail store marketing manager wants to know if there is a significant association between the geography of a customer and his/her brand preferences.
Business Benefit: Once the test is completed, p-value is generated which indicates whether there is significant association between geography and brand preference. Based on this value, a retail store marketing manager can design the ongoing marketing campaigns for different brands to address different geographical customers/prospect preferences.
Use Case – 2
Business Problem: A marketing researcher wants to know if gender has an influence on political party preference.
Business Benefit: Once the test is completed, p-value is generated which indicates whether there is significant association between gender and political party preference. If significant association is found, then both males and females can be targeted with different political campaigns to turn their votes in preference of a political client.
The Chi Square Test of Association Method of Hypothesis Testing allows businesses to test theories regarding the relationship of one or more data points to another data point to determine possible influencing factors for product purchases, or other outcomes.
The Smarten approach to augmented analytics and modern business intelligence focuses on the business user and provides tools for Advanced Data Discovery so users can perform early prototyping and test hypotheses without the skills of a data scientist. Smarten Augmented Analytics tools include assisted predictive modeling, smart data visualization, self-serve data preparation, Clickless Analytics with natural language processing (NLP) for search analytics, Auto Insights, Key Influencer Analytics, and SnapShot monitoring and alerts. These tools are designed for business users with average skills and require no specialized knowledge of statistical analysis or support from IT or data scientists. Businesses can advance Citizen Data Scientist initiatives with in-person and online workshops and self-paced eLearning courses designed to introduce users and businesses to the concept, illustrate the benefits and provide introductory training on analytical concepts and the Citizen Data Scientist role.
The Smarten approach to data discovery is designed as an augmented analytics solution to serve business users. Smarten is a representative vendor in multiple Gartner reports including the Gartner Modern BI and Analytics Platform report and the Gartner Magic Quadrant for Business Intelligence and Analytics Platforms Report.


