Leverage Integrated Analytics Reporting in Tally ERP!
The Rochester Institute of Technology (RIT) states that, ‘Accounting analytics can help an organization answer financial questions by looking at all the data gathered by a company (e.g., transactional data, financial data, investment analysis, etc.) and analyzing this information to gain significant insights, predict future outcomes, or even ascertain risk.’
‘There is no doubt that the amount of information contained in accounting and finance systems can be daunting but analysis of this data in an easy-to-use reporting environment can reap numerous rewards without reducing productivity or frustrating users.’
For accounting firms serving a client base or accountants within a business who are tasked with managing expenses, there is no doubt that a basic accounting system is mandatory. But, in today’s competitive environment, the do-more-with-less approach is rampant and accountants, finance professionals, inventory managers, purchasing managers and other finance-related professionals find it increasingly difficult to manage the data and monitor it in a way that provides value to clients and colleagues.
New roles include a value-based approach where the team is expected to provide insight, reduce expenses, spot trends, make recommendations and do it all in a fact-based environment where missteps will be mitigated and competitive advantage is key.
For users of the Tally® ERP Solution, the availability of integrated augmented analytics and reporting provides true benefits. The integration of analytics across all modules allows team members to analyze and report on data to solve problems, identify opportunities and make recommendations that will advance the interests of the business using a desktop or a mobile app approach.
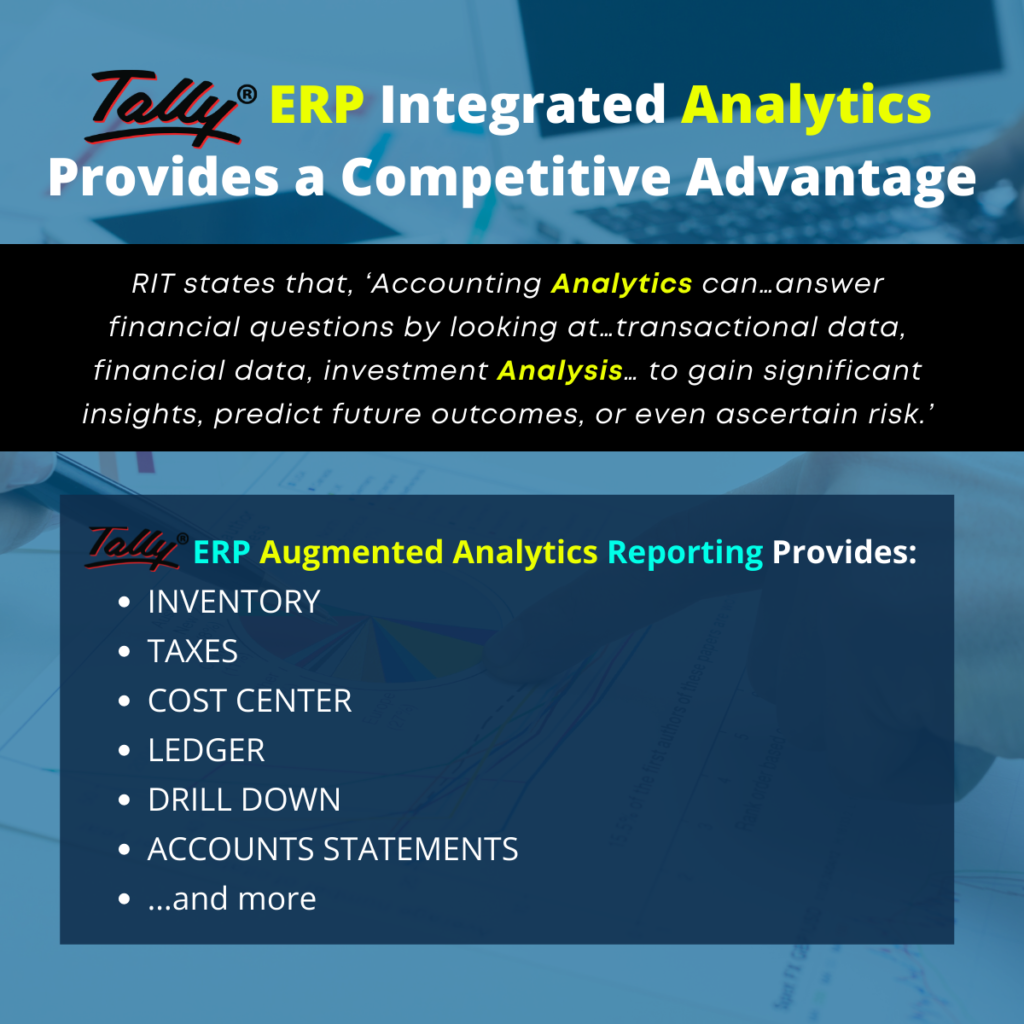
Available Reports Include:
OVERVIEW
Overview of key business parameters, e.g., Sales, Purchase, Payable & Receivable, Income & Expense, Cash & Bank and Duties and Taxes, and monthly trends. Also includes Top and Bottom Analysis, Contribution Analysis, and KPI analysis of these key indicators.
SALES & PURCHASE
Explore sales to date, and monthly, quarterly and yearly KPI and trends. Analyze monthly sales, top customers and detailed sales register.
BANK & CASH
Reveal trends and patterns in banking and cash results over a period of time. Users can compare results from previous time periods.
PAYABLE & RECEIVABLE
Breakdown payables and receivables by creditors and debtors as well as by products, services and components. Look for trends for overdue collections.
INVENTORY
Analyze inventory for shortages and overages. Explore overstock, understock, suppliers, products and shipping and distribution.
TAXES
Examine previous taxes, tax due summary, estimate tax obligations, analyze taxes for future periods.
COST CENTER
Analyze cost center balances and movements by cost center groups, cost center accounts as well as their association with ledgers.
LEDGER
Analyze ledger entries and balances in details with drill-down to individual voucher level.
DRILL DOWN
Pre-built drill-down views to balances at higher level groups, and drill down in hierarchy to ledger and transaction level.
ACCOUNTS STATEMENTS
Ideal for accountants for statutory submission purposes, and to review balance sheet statement, trial balances, profit and loss statements and more.
REPORTS
Various interactive reports with drill-down to slice and dice data by vendor, product, service, cost, sales person, location, customer, inventory, purchasing, costs, etc.
When these reports and tools are combined with the skill and knowledge of an accounting or a finance professional, the results can be profound. There is no doubt that the amount of information contained in accounting and finance systems can be daunting but analysis of this data in an easy-to-use reporting environment can reap numerous rewards without reducing productivity or frustrating users.
‘The integration of analytics across all modules allows team members to analyze and report on data to solve problems, identify opportunities and make recommendations.’
Find out how the addition of SmartenApps For Tally will support analytical initiatives and provide benefits to your users and your enterprise. Users can Download And Register for SmartenApps for Tally and use Tally data to analyze, explore and clarify and to provide insight to clients, colleagues, management and team members.
Original Post : Tally ERP Integrated Analytics Provides a Competitive Advantage!


