This article describes the Simple Linear Regression method of analysis.
What is Simple Linear Regression?
Simple Linear Regression is a statistical technique that attempts to explore the relationship between one independent variable (X) and one dependent variable (Y). This method helps a business to identify the relationship between X and Y and the nature and direction of that relationship.
Here is a sample of simple linear regression analysis, considering the effects of temperature on crop yield:
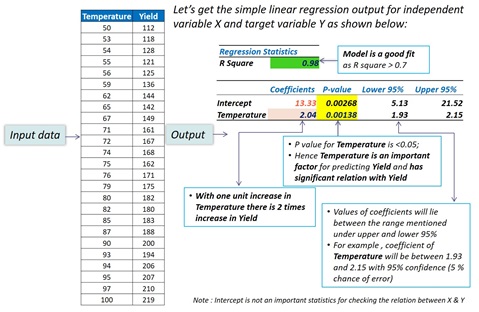
Simple linear regression is limited to predicting numeric output i.e., dependent variable has to be numeric in nature. This method of analysis can handle only two variables, namely one predictor and one dependent variable.
How Can the Enterprise Use Simple Linear Regression to Analyze Data?
Let’s look at two use cases that illustrate the value of Simple Linear Regression.
Use Case – 1
Business Problem: An eCommerce company wants to measure the impact of product price on product sales.
Input Data: The predictor/independent variable is product price data for last year. The dependent variable is product sales data for last year.
Business Benefit: The product sales manager can identify the amount and direction of product price impact on product sales. The organization can make confident decisions on product pricing and sales targets for a particular product.
Use Case – 2
Business Problem: An agriculture production firm wants to predict the impact of rainfall amounts on the yield of particular crop.
Input Data: The Predictor/independent variable is the amount of rainfall during the monsoon months of the last year. The dependent variable is crop production data during the monsoon months of the last year.
Business Benefit: An agriculture firm can predict the yield of a particular crop, based on the amount of rainfall this year and can plan for alternative crop contingencies if the amount of rainfall is not adequate enough to achieve the targeted crop production.
Simple Linear Regression is a useful analytical technique when an organization wants to explore and analyze existence and nature of a relationship between one independent variable (X) and one dependent variable (Y). The Simple Linear Regression technique is not suitable for datasets where more than one variable/predictor exists.
The Smarten approach to augmented analytics and modern business intelligence focuses on the business user and provides tools for Advanced Data Discovery so users can perform early prototyping and test hypotheses without the skills of a data scientist. Smarten Augmented Analytics tools include assisted predictive modeling, smart data visualization, self-serve data preparation, Clickless Analytics with natural language processing (NLP) for search analytics, Auto Insights, Key Influencer Analytics, and SnapShot monitoring and alerts. These tools are designed for business users with average skills and require no specialized knowledge of statistical analysis or support from IT or data scientists. Businesses can advance Citizen Data Scientist initiatives with in-person and online workshops and self-paced eLearning courses designed to introduce users and businesses to the concept, illustrate the benefits and provide introductory training on analytical concepts and the Citizen Data Scientist role.
The Smarten approach to data discovery is designed as an augmented analytics solution to serve business users. Smarten is a representative vendor in multiple Gartner reports including the Gartner Modern BI and Analytics Platform report and the Gartner Magic Quadrant for Business Intelligence and Analytics Platforms Report.


