In this article, we will discuss the Decision Tree analysis method.
What is Decision Tree Analysis?
There are two basic types of decision tree analysis: Classification and Regression.
1) Classification Trees are used when the target variable is categorical and, as the name implies, are used to classify/divide the data into these predefined categories of a target variable.
Let’s look at two examples:
- Based on the historical data related to credit card payments, loan payments, delinquency rate, outstanding balance we want to classify/divide the customers into those who default and those who do not default.
- To access the characteristics of a customer such as his or her purchase frequency, income, age, type of bank account, occupation etc. that leads to purchase of a particular banking product such as installment loan, personal loan, checking account etc.
Let’s take a closer look at an example of classification tree analysis. Let’s say we have only two predictors, namely the level of Alcohol and free sulfur dioxide in a wine and we want to predict if wine quality (target variable) will be high or low.
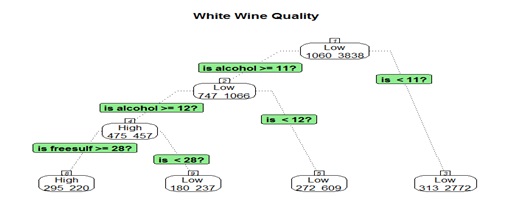
Since the target variable wine quality contains categorical values (high and low), the classification method will be applicable, as the predictors will be classifying the data into high and low.
2) Regression Trees are used when the target variable is numeric.
Let’s look at an example:
A business will analyze the past behavior of customers on a retail website, and look at variables like the number of days from the last purchase, the brand preference, income, age, gender, website visits, location, and the total amount of purchases. If we want to predict the purchase amount by each customer, regression trees are useful. Here the target variable would be the purchase amount. Similarly, regression trees can also be used to identify the market segment, identifying who is more likely to respond to a future mailing.
In this example, the segments that have a response rate higher than the overall response rate can be targeted first since they will require less effort to convert to a purchase, whereas a different marketing strategy must be devised for the lower segments (segments that have a response rate less than the overall rate).
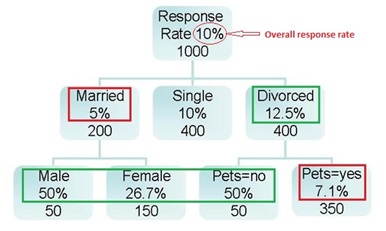
How Does Decision Tree Analysis Help an Organization to Analyze Data?
Let’s look at a few use cases that illustrate the benefits of the Decision Tree Classification Method.
Use Case – 1
Business Problem: Based on the historical customer attributes such as his/her credit card payments, loan payments, outstanding balance etc., a bank needs to classify customers into those that will default and those that will not default. In this case, the classification tree can be used to access the characteristics of customers that are likely to default.
Business Benefit: The bank can decide which customer segments are eligible for any type of loan and the customer segments that should be denied any loan, as they are likely to default. In this way, the riskier customers are identified easily and bank can avert the risk of delinquencies.
Use Case – 2
Business Problem: Based on customer attributes and past online shopping behavioral data, an online retail giant wants to predict the future purchases of customers. Here predictors can be ‘days from last purchase’, ‘brand preference’, ‘income’, ‘age’, ‘gender’, ‘website visits’, ‘location’, ‘total amount of purchase so far’ etc. As the target variable is numeric, namely the purchase amount, the regression tree can be used to predict the purchase amount by different types of customer segments.
Business Benefit: Online retailers can identify the customer segments with a higher capacity to purchase, and can design special marketing strategies for these types of segments, which are their main revenue drivers. This way, premium customers can be given special attention to retain their loyalty and in turn, revenue can be increased.
The Decision Tree analysis technique is useful in classifying and segmenting markets, types of customers and other categories in order to make decisions on where to focus enterprise resources.
The Smarten approach to augmented analytics and modern business intelligence focuses on the business user and provides tools for Advanced Data Discovery so users can perform early prototyping and test hypotheses without the skills of a data scientist. Smarten Augmented Analytics tools include assisted predictive modeling, smart data visualization, self-serve data preparation, Clickless Analytics with natural language processing (NLP) for search analytics, Auto Insights, Key Influencer Analytics, and SnapShot monitoring and alerts. These tools are designed for business users with average skills and require no specialized knowledge of statistical analysis or support from IT or data scientists. Businesses can advance Citizen Data Scientist initiatives with in-person and online workshops and self-paced eLearning courses designed to introduce users and businesses to the concept, illustrate the benefits and provide introductory training on analytical concepts and the Citizen Data Scientist role.
The Smarten approach to data discovery is designed as an augmented analytics solution to serve business users. Smarten is a representative vendor in multiple Gartner reports including the Gartner Modern BI and Analytics Platform report and the Gartner Magic Quadrant for Business Intelligence and Analytics Platforms Report.


