Smart Data Visualization Tells a ‘Story’ and Provides Data Insight!
Clarity is crucial to business success. The enterprise may need to make a decision about investment, product pricing, opening a new location or other issue. Team members may need to gather and present data to make a recommendation to change activities or direction. No matter how or why you are using data, the presentation of that data, and the ability to provide flexible visualization and reporting can dramatically change your outcome.
Finding the insight and the all-important ‘nuggets’ of information is critical to success. To do that, your team must have the tools and access to dig out from under those piles of data, columns, and rows, and use the data to tell a story.
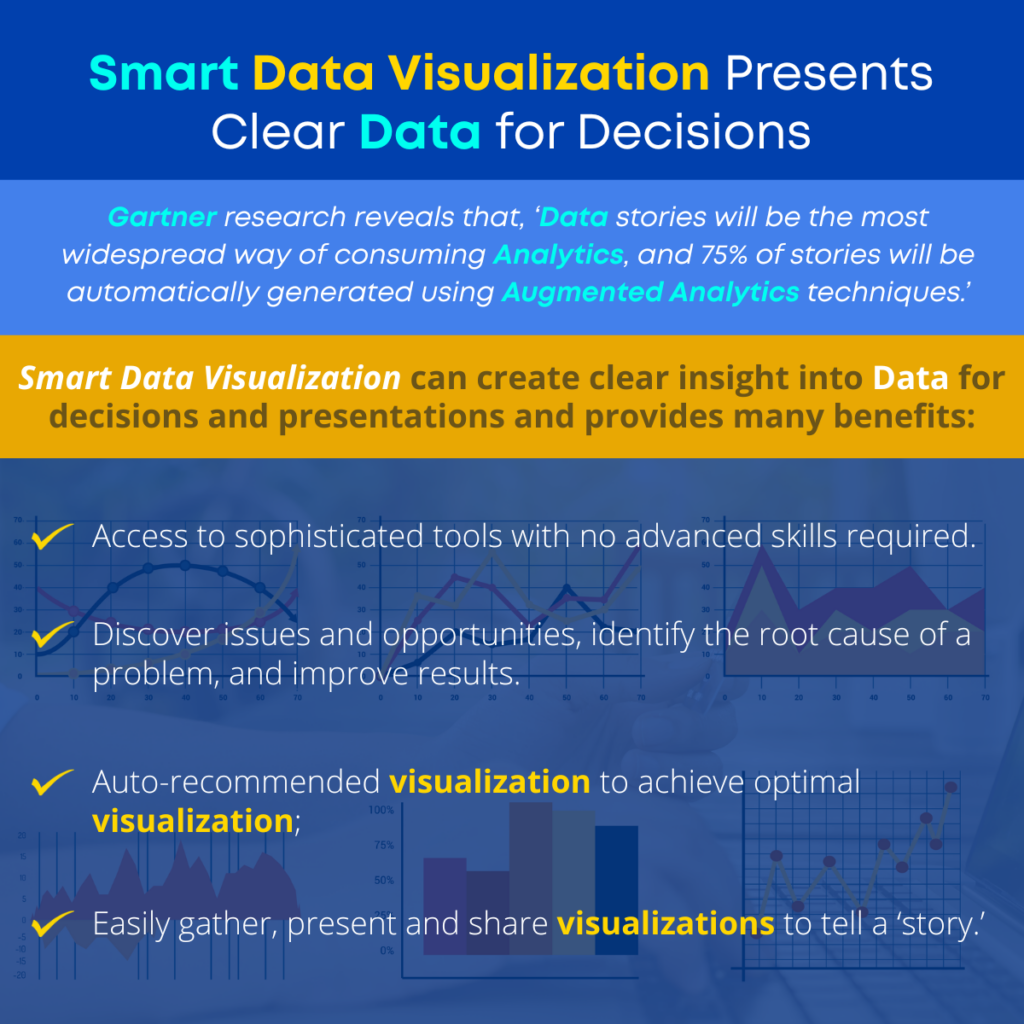
Gartner research reveals that, ‘data stories will be the most widespread way of consuming analytics, and 75% of stories will be automatically generated using augmented analytics techniques.’
If your business wants to support the data story approach to data presentation and consumption, it must provide augmented analytics tools for smart data visualization.
‘Smart Data Visualization provides access to sophisticated tools in a self-serve environment that requires no advanced skills.’
Smart Data Visualization allows business users to analyze, share and present information without waiting for assistance from visualization experts or programmers so your team can cut through that mountain of data to find those elusive nuggets of information that have the most impact on business results. Users can view and analyze data to identify a problem and clarify a root cause and to make confident decisions and they can interact easily with data discovery tools and analytics software and build a view that will tell a story using guided visualization and recommended data presentation so there is no need for assistance or delays. Guided recommendations are made based on data type, volume, dimensions, patterns, and nature of data.
Visual Analytics tools enable users to identify relationships, patterns, trends, and opportunities and to explore detailed data with simple drill down and drill through capabilities and make sense of data from all sources, with a guided approach that allows users to identify patterns and trends, and quickly complete analysis with clear results.
Here are just a few of the benefits of Smart Data Visualization:
- Smart Data Visualization provides access to sophisticated tools in a self-serve environment that requires no advanced skills.
- The team can go beyond data monitoring to discover issues and opportunities, identify the root cause of a problem, and improve results.
- The auto-recommended visualization environment allows users to achieve optimal visualization from underlying data for powerful insights.
- Users can easily gather, present and share visualizations to tell a ‘story’ and provide clarity for decision-making.
‘If your business wants to support the data story approach to data presentation and consumption, it must provide augmented analytics tools for smart data visualization.’
Discover the ease-of-use and clarity of Smarten Smart Data Visualization and Augmented Analytics Products. Give your team the power of insight and go beyond data monitoring to find the real answers!


