This article describes the analytical technique of random forest regression.
What is Random Forest Regression?
Random Forest Regression creates a set of Decision Trees from a randomly selected subset of the training set, and aggregates by averaging values from different decision trees to decide the final target value.
Random Forest Regression is limited to predicting numeric output so the dependent variable has to be numeric in nature. The minimum sample size is 20 cases per independent variable.
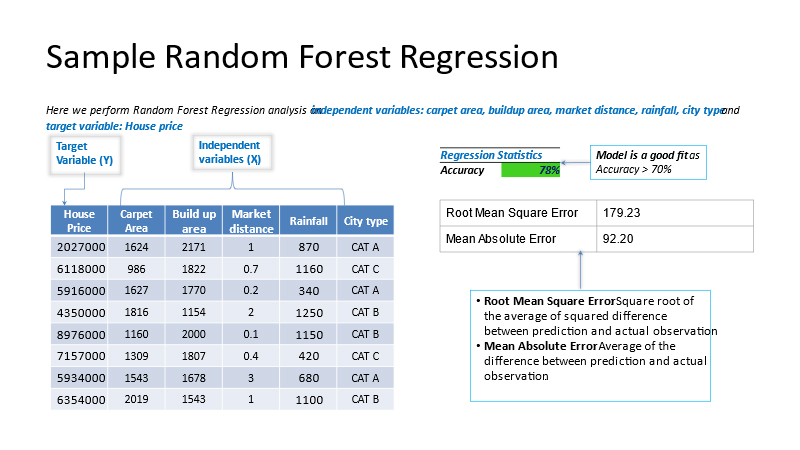
To further clarify the use of the Random Forest Regression model, let’s look at a sample analysis to optimize house pricing, based on numerous variables:
How Can Random Forest Regression Help Your Business?
Explore the use cases below, to better understand the value of Random Forest Regression.
Business Use Case – House Price
Business Problem: A real-estate brokerage company wants to measure the impact of locality, the number of rooms, the area(sq. yards) etc. on a house price. The goal of this statistical analysis is to help us understand the relationship between house features and how these variables are used to predict house price.
Target: House Price
Predictors: Area with carpet, Rainfall, city, parking, distance from hospital, distance from shopping, etc.
Business Benefit
- The business can determine which predictors have a significant impact on house price.
- Pricing strategies and recommendations will be more accurate and result in quicker sales.
- If the number of rooms or the distance from shopping or schools are significant factors, these factors are given more focus when searching for a house that fits a client budget and affects profit.
Business Use Case – Agriculture
Business Problem: An agriculture business wants to measure the impact of weather, market price, quality of crop, land used etc. on the crop price.
Input Data: Predictor/Independent Variables
- Weather
- Demand
- Crop health
Dependent Variable: Crop Price
Business Benefit
- Business can clarify which factors have a significant impact on crop price.
- Pricing strategies can be refined to improve accuracy and meet targeted crop pricing and revenue.
- If crop health and climate are significant factors, these factors would receive more focus when deciding crop price.
Business User Case – Compensation Policies
Business Problem : A business wishes to measure the salary of employee based on position, experience, degree, level, productive hours etc.
Input Data: Predictor/Independent Variables
- Position
- Years of experience
- Productive hours
Dependent Variable: Salary of Employee
Business Benefit
- The business can clarify which predictors have a significant impact on employee salary.
- Salary policies and strategies can more accurately reflect employee value and targeted salaries.
- If productive hours and experience are significant factors, these factors would be given more focus when developing salary policies.
The Smarten approach to augmented analytics and modern business intelligence focuses on the business user and provides tools for Advanced Data Discovery so users can perform early prototyping and test hypotheses without the skills of a data scientist. Smarten Augmented Analytics tools include assisted predictive modeling, smart data visualization, self-serve data preparation, Clickless Analytics with natural language processing (NLP) for search analytics, Auto Insights, Key Influencer Analytics, and SnapShot monitoring and alerts. These tools are designed for business users with average skills and require no specialized knowledge of statistical analysis or support from IT or data scientists. Businesses can advance Citizen Data Scientist initiatives with in-person and online workshops and self-paced eLearning courses designed to introduce users and businesses to the concept, illustrate the benefits and provide introductory training on analytical concepts and the Citizen Data Scientist role.
The Smarten approach to data discovery is designed as an augmented analytics solution to serve business users. Smarten is a representative vendor in multiple Gartner reports including the Gartner Modern BI and Analytics Platform report and the Gartner Magic Quadrant for Business Intelligence and Analytics Platforms Report.


